Windows
Trial Available
Rapid scientific plots & analysis — without the tool chaos.
GraphXYZ is a Python‑based GUI application designed to be your all‑in‑one workspace for plotting and analyzing scientific data. Stop juggling instrument exports and mismatched tools; import, visualize, analyze, and export from one place.
Download the trial
Why GraphXYZ?
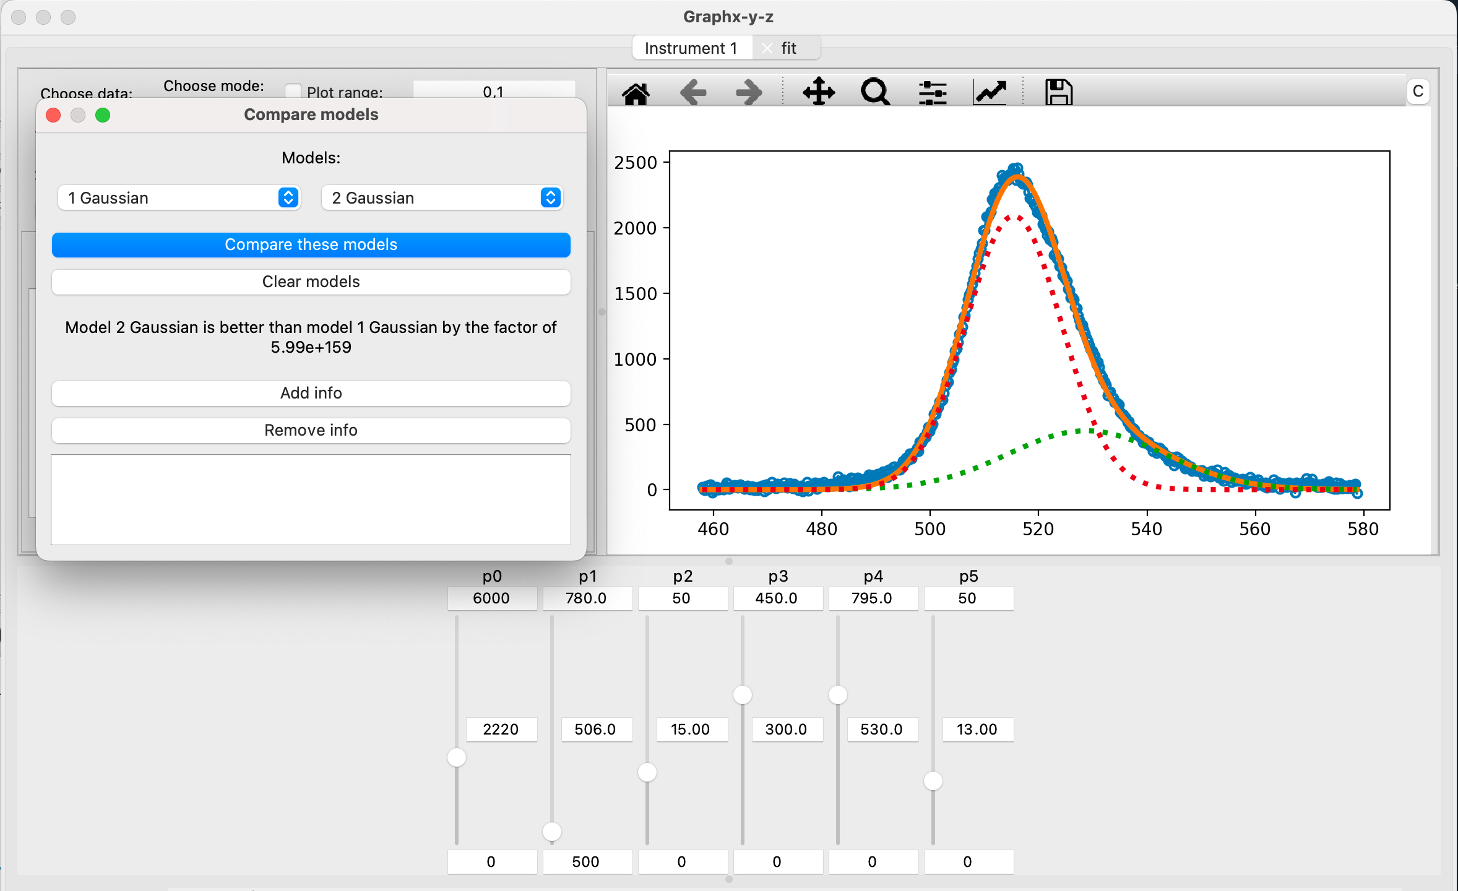
Unified analysis workflow
Import from multiple instruments, visualize instantly, apply filters, fit peaks, and export—all without switching tools.
Rapid plotting at scale
Handle dozens of datasets with smooth interactions, live updates, and quick compare/overlay views.
GUI that stays out of your way
Drag & drop data, context‑aware tooltips, keyboard shortcuts, and export presets for publications.
Scientific toolbelt
Baseline correction, smoothing, FFT, statistics, curve fitting, and annotations ready for lab notebooks.
Cross‑platform Python core
Built with Python for reliability and portability; ships as native installers for Windows, macOS, and Linux.
Local by default
Your data stays on your machine. No analytics or cloud upload required during the trial.